What you need to know
about China’s food ingredients market before visiting the Exhibition FIC 2017
in Shanghai on March 26-28.
The
Food Ingredients China 2017 (FIC 2017), held from March 24-26 in Shanghai, is
an international brand show in the food industry with a huge influence on the
development of the food ingredients and additives market in China. Highlights
of this exhibition are usually product and technology launch events, as well as
academic forums and lectures. This year, the exhibition will cover 23 segments
of food additives, 35 categories of food ingredients, food processing aids,
novel food, and food machinery.
The
FIC 2017 is expecting 1400 exhibitors from worldwide, while about 90% of them
will be manufacturers and exporters. The highlight for this year is set on
natural & healthy food as well as the machinery zone. Meet China’s biggest
players in the food ingredients industry to stay ahead in the market in China.
The
event displays commodities like antioxidants, bulking agents, egg products,
natural and organic food and additives, oils and fats, food processing
equipment, food testing equipment, vegetable protein, frozen and chilled food,
packaging machinery and materials, and honey as well as honey extracts,
Some
of China’s manufacturers, which you can visit at the exhibition for
critical relationship building, are:
Shijiazhuang
Dongfeng Chemicals Co., Ltd.
Shijiazhuang
Lida Chemical Co., Ltd.
Inner
Mongolia Jianlong Biochemical Co., Ltd.
The
FIC is the main platform to build sustainable relationships with China’s
players in the food ingredients industry, just like vitamins, amino acids,
starch, sweeteners and more. Hence, knowing about the market industry in China
can be the critical factor in making the best out of visiting the exhibition.
CCM helps you to prepare for the FIC 2017 with the analysis of China’s most
important food ingredients and additives segments.
Vitamins
China’s
vitamins have witnessed great surges in the first three-quarters of 2016. The
biggest winners have been especially vitamin A, vitamin E, vitamin B5, and
vitamin B2.
Vitamin E & A
According
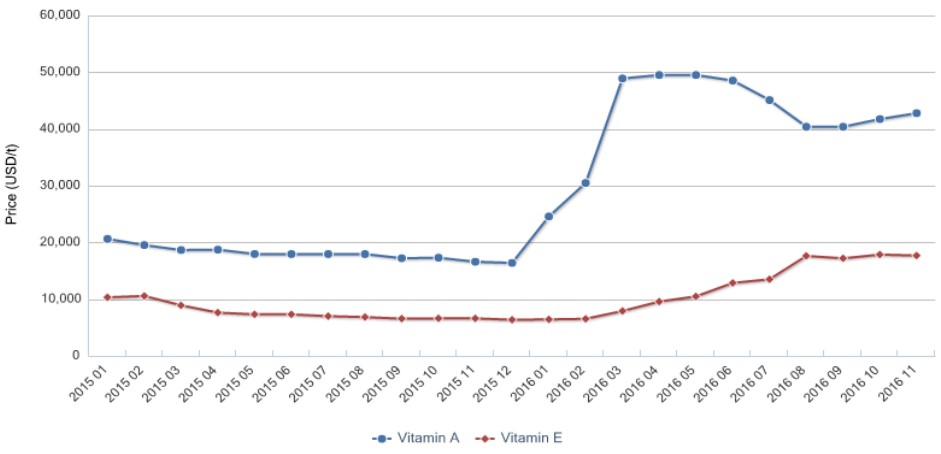
to CCM’s price monitoring, the biggest price hike in terms of percentage rise
has been seen for vitamin E. This vitamin, as in 50% feed grade powder, was
able to surge over 173% from January to August 2016. The second rank can be
given to vitamin A, as it has shown a price boost of over 100% from January to
April 2016. However, after the peak in April, the price for feed grade vitamin
A fell again until it remained stable about slightly over USD40,000/t. China’s
manufacturers enjoyed huge profits during the price hikes, as the financial
performance of producers like Zhejiang NHU and Zhejiang Medicine shows.
Monthly market prices
of feed grade vitamin A (500,000 IU/g) and 50% feed grade vitamin E, Jan.
2015-Nov. 2016
Source: CCM
The
reasons for this massive increase can be found in the tight supply situation as
well as rising demand for vitamin A globally. The short supply was caused by a
massive production reduction of one of the world leading vitamins manufacturers.
In December, one of the main factories was shut down for maintenance, which
lasted for three months and showed the significant shorter supply of vitamin A
in the market. As a result, many companies turned their eyes to Chinese
suppliers, which could raise their prices accordingly.
Furthermore,
in January 2016, the domestic demand for vitamin A was increasing once more.
This demand was due to the upcoming Chinese New Year festival, which is
traditionally a period of high demand for food ingredients in general. The spring
festival also had the effect, that the country-wide holiday led to a reduction
of Chinese producers, increasing the short supply in that period even more.
Looking
at the next quarter, Q2, the short supply of vitamin A was still going on. This
time, it was due to the shortage of an important upstream product of vitamin A,
namely citral. Hence, the prices stayed on a very high level with even a
further slight increase. During Q3 the global demand for vitamin A decreased
again, which resulted in a moderate fall of prices as well.
Then,
on October 17, 2016, a big news was brought from Germany. In one of the plants
of the biggest worldwide supplier of the raw material citral, BASF, an
explosion occurred, leading to a shorter supply of this raw material and hence
to higher prices for vitamin A again. The rising prices were also supported by
the high demand of purchasers, who were worried about the following vitamin A
supply and purchased lots of vitamin for their stockpile.
Vitamin B5
Vitamin
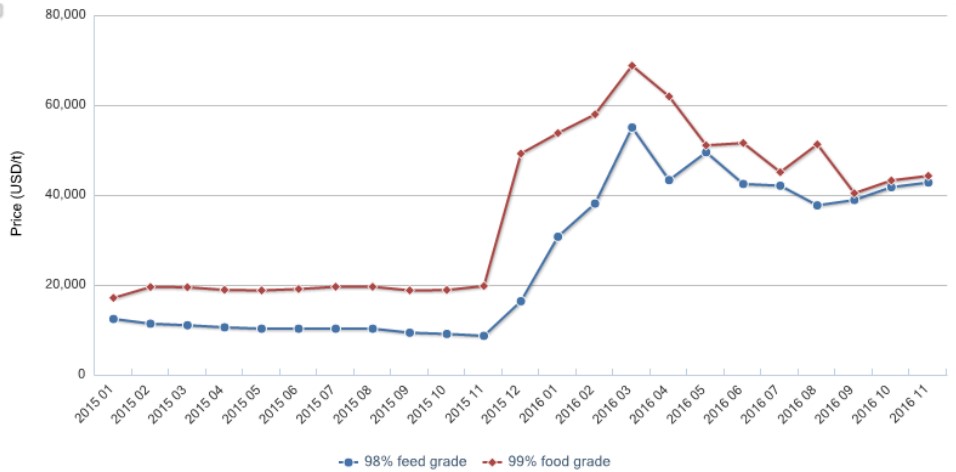
B5 price showed an immense surge after a very stable trend in 2015. The peak
for both, 98% feed grade and 99% food grade did reach the peak in March 2016.
They then fell down in average until September 2016, just to start a price
growth again at the end of the year.
Monthly market prices
of vitamin B5 (98% feed grade and 99% food grade) in China, Jan. 2015-Nov. 2016
Source: CCM
Vitamin B2
The
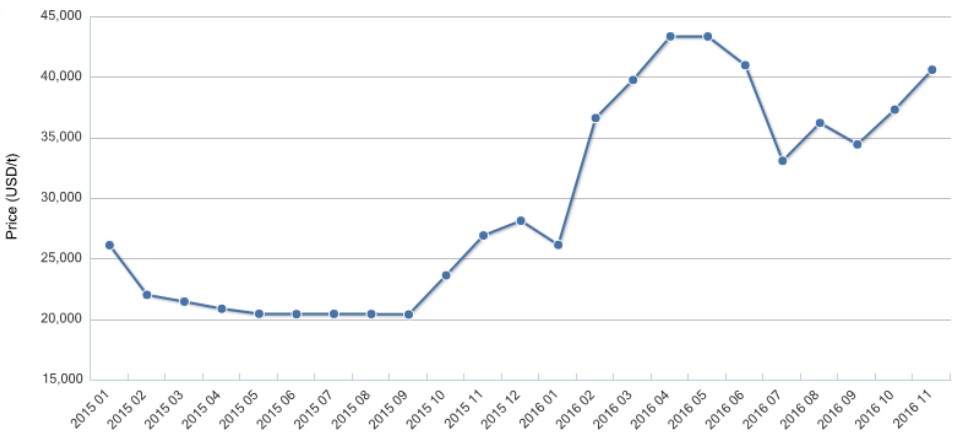
vitamin B2 price trend went similar to the vitamins mentioned. After the
hovering over a relatively low price in 2015, this vitamin experienced A boost
already at the end of 2015 with continuing until April of 2016. The price then
fell down to a certain extent, until the price went rising again at the end of
the year 2016. The big winner of the price surge is China’s largest vitamin B2
producer, namely Guangji Pharmaceutical, who also heads the global vitamin B2
market in output and sales.
The monthly market
price of 80% feed grade vitamin B2 in China, Jan. 2015 -Nov. 2016
Source: CCM
Vitamin C
Nevertheless,
other vitamins, like vitamin C, also showed a rising price trend at the end of
2016. The price of vitamin C witnessed another growth in November 2016 by
16.67% YoY. Market intelligence firm CCM gives two reasons for the price
rebound of vitamin C in China, Q4 2017.
The
first reason is the reduced market supply of vitamin C in China. The shrunken
supply was caused by decreasing inventories of vitamin C together with
production limitations of Chinese producers due to maintenance and
environmental protection measurements.
The
second reason for the price hike can be found in the announcement of one of
China’s biggest vitamin C producers DSM Aland Nutraceuticals. The raised prices
quotations are supposed to reflect increasing cost pressure and the need of
investments for its facility.
Environmental
Protection Law
The
new Environmental Protection Tax Law was revealed on December 25, 2016, and is
going to come into effect in the beginning of 2018. It will mainly replace the
current pollution discharge fee by the Chinese government with a new
environmental protection tax.
The
new law is the first one of its kind in China, aiming to get successful actions
against the growing pollution in the country and protect the environment from
heavy pollution discharges of several industries. The key factor to convince
enterprises establishing environmental friendly productions and discharge
systems lays in a tax reduction for significant pollution reducing actions.

To
be more precise, the tax allows a tax reduction of 25%, if the pollution
discharge, mainly wastewater and air pollution, is 30% lower than the national
or provincial standard for this pollution concentration. If the company is even
able to keep its pollution 50% lower than the standard concentration, they can
apply for a 50% tax reduction at all. So, the system clearly benefits
environmental protection solutions of enterprises with lowering their costs.
Besides air and water pollution, also noise pollution will be charged by taxes.
The
vitamins industry is one of the heavily polluting industries, beneath
chemicals, cement, and pharmaceutical industry. As a result, the environmental
protection tax law will without any doubt have a massive effect on the
manufacturers in China and their efforts for a cleaner production.
Now
with the implementation of the new law, China’s manufacturers are facing
stricter regulations, that are threatening the regular business they are doing.
In the long term, the law may force traditional producers with a lack of
innovation and technological upgrades to shut down the business.
Amino Acids
Methionine
China’s
and worldwide leading manufacturers of methionine, and those who want to become
one are increasing efforts in the production of methionine. These plans to
penetrate into the market may lead to an overcapacity in the near future.
Zhejiang NHU, Bluestar Disseo, and Chongqing Sanxia, just to name three
companies, are expanding their production by building new facilities or
purchasing existing methionine producing enterprises.
Also,
the world biggest methionine producer, Evonik, which is currently responsible
for about 35% of global sales of methionine, has recently started to build a
new plant in Singapore with an estimated production capability of 150,000
tonnes a year by 2019.
The
increasing efforts are based on the optimistic outlook for the Asian methionine
market, especially the one in China, as China is the leading methionine
consumer with a demand of over 225,000 tonnes in 2016, according to CCM. The
domestic need, especially for the animal feed industry, is going to rise about
10% to 15% in the next years, experts predict. Hence, the competition in this
promising market is attracting many enterprises in China and overseas.
Besides
Evonik, a few other enterprises, namely Adisseo, Novus International, and
Sumitomo, are accounting for 90% of global sales. This shows the high
monopolistic attitude of this market, due to the complicated production
processes. However, China’s manufacturers are starting to catch their piece of
the cake by entering the market. Examples for new players in China are Ningxia
Unispledour, Zhejiang NHU, and Sichuan Hebang.
If
the plans of the new players become reality, China would face a methionine
production of 600,000 tonnes by 2020, facing the total demand of 447,000
tonnes. Hence, a huge overcapacity is likely to be the result of the
strengthened competition in China.
Lysine
China’s
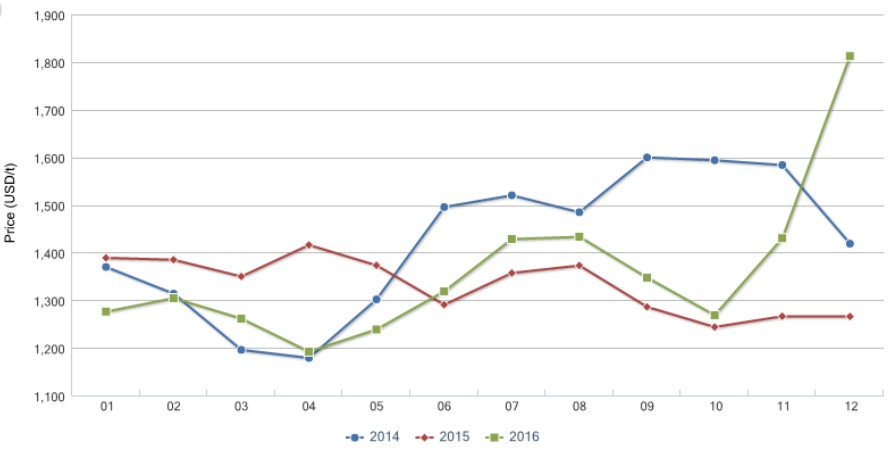
lysine market, on the other hand, has been facing a huge fluctuation throughout
the year 2016. According to CCM’s price monitoring, the overall downtrend of
price in 2016 went on in the beginning of 2016. It then rebounded and were able
to rise till the third quarter of 2016. Looking at the year on year change in
2016, China’s lysine price witnessed an overall rise of USD26.32/t.
The monthly market
price of 98.5% lysine in China, Jan. 2014-Dec. 2016
Source: CCM
The
main two reasons for the large fluctuation can be found in the changes of corn
price in China and the intensified transportation pressure.
The
price of lysine is strongly bound to the price development of corn in China,
seen it as the main raw material. So, when the corn price fell in the first
months of 2016, due to huge oversupply, the lysine price was reduced as well.
The rebound in April was then the reaction of tighter supply in the domestic
market before the launch of the national auction for temporarily stored corn.
The
rebound of lysine in November is the result of the winter start in China,
leading to a prioritised transportation of coal for heating instead of food
additives like lysine. Another factor is the new traffic regulations,
implemented in September, which require a lower transportation capacity. These
effects led to a reduced supply and hence surging prices.
Looking
at the exports of lysine ester and salt from China in 2016, a boost of 26.62%,
compared to 2015, can be seen. According to CCM, this trend can be explained by
the low export price of lysine, combined with the continuing depreciated RMB.
Overseas manufacturers have been preferred the cheap food additive from, China
instead of the local ones.

What’s
more, China’s manufacturers witnessed great net profit performances in 2016,
due to the lower production costs. The future looks promising as well, due to
the high lysine price, increasing exports, and the still falling costs of corn
in China. Hence, domestic manufacturers are very likely to continue the great
performance ongoing.
Sweeteners
Many
factors are affecting the sugar and sweetener market in China recently.
Environmental health policies are limiting the production of sweeteners in
China. Also, a Pollutant Discharge Licensing System is being implemented, which
will without any doubt influence the sweeteners industry in China ones more.
The financial performance of Chinese sugar manufacturers varied greatly in Q3,
resulting in increasing production costs, rising sugar price, and decreasing
sales volume. In 2015 and 16 the planting area of sugarcane in China decreased,
leading to a shortage of sugar, which is the main reason for the current high
prices.
Sugar
During
the last year, the planting area of sugarcane did decrease. This causes a
higher purchase cost for the sugar producers, due to shorter supply.
Additionally, some heavy rain during that time also reduced the quality of
sugarcane, increasing the cost of sugar manufacturing ones more.
The
increasing costs even exceeded the increasing prices of sugar, which actually
led to losses for many manufacturers, according to CCM’s analysis. Downstream
users searched for substitutes for the more expensive sugar in China, also led
to a declined sales volume.
CCM
furthermore predicts that the sugar price will continue rising in China. The
reasons are a depreciating RMB, limited growth of the sugar output in 2016 and
17 as well as expected decreased imports. However, the price rise will be
limited, due to the launch of the national sugar reserves, the new production
of sugar in the coming period and more substitutes for sugar.
Sucralose
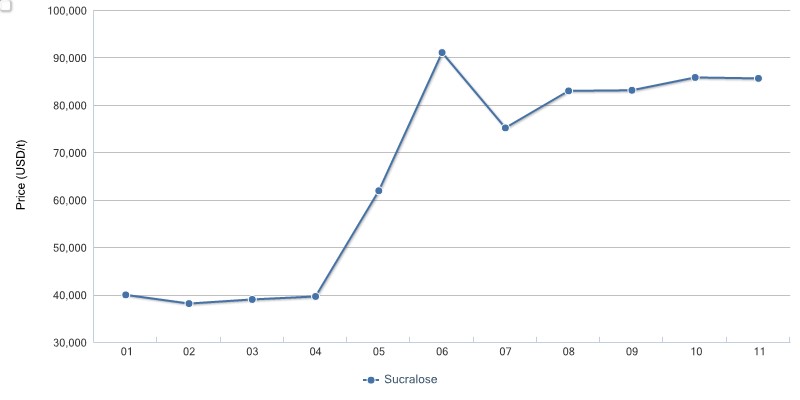
Sucralose
experienced an increase of over 100% in 2016, mostly caused by short supply
because of environmental protection and the resulting price rise. It is
expected, that manufacturers grow their production to balance the short supply,
which will shrink prices again.
Ex-works price of sucralose
in China, Jan.-Nov. 2016
Source: CCM
The
case of JK Sucralose’s production suspension demonstrates the short supply
situation of sucralose in China 2016. It even led to a lack of inventory for
many companies.
The
company had to reduce production because of the order from the Environmental
Protection Bureau of Jiangsu Province, stating, that the wastewater treatment
of the facility didn’t meet standards. JK Sucralose is the largest sucralose
manufacturer in China and the second biggest in the world, with a capacity of
2,000 t/a, so the suspension of his production had a huge impact on the supply
situation in China. The reduction affected about 40% of production, which makes
the producers still larger than competitor’s production.
According
to CCM, the ex-works price of sucralose was USD86,912/t in November 2016.
That’s just a 1.28% rise MoM, but more than 100% compared to January 2016.
The
fastest growth took place in June with 56.25% increase alone.
Since
sucralose is made of sugar, the increasing sugar price is affecting the
sucralose price immensely. According to sucralose manufacturers, a further
price rise of sucralose is very likely, if the sugar price keeps rising as
well.
Starch, MSG, and DDGS
Corn Starch
China’s
corn starch industry was finally on the rise again in 2016, due to four
game-changing factors that benefited the development.
First
of all, the falling corn prices in China have reduced the production costs of
corn starch to a great extent. Second, the consumption of corn starch in
several industries in China has witnessed a growth of between 27.1% up to 56%.
Industries with a large increasing demand have been the paper making industry
as well as the food industry. But also, modified starch and beer has become
more demanded in China.
As
a measurement to ease the heavy oversupply of corn in China, several provinces
have implemented subsidies for corn processing, which was mainly happening in
the starch and alcohol industry. Hence, companies in these areas have increased
their efforts to enlarge the production. Finally, a rising export volume also
has strengthened the corn starch industry in China, facing a year on year
increase of exports by 97% in January to November 2016.
Potato Starch
In China, potato starch is the main processed outcome of potatoes. China is
furthermore the largest potato producer and consumer. Hence, a large effort is
set on the enhancement of the potato starch industry. However, the industry is
facing some challenges, namely a current overcapacity, which can be solved by a
low output and the irrational consumption while facing the “staple food”
strategy.
The
growing output of potato starch capacity in China has reached 2.3 million
tonnes a year. However, this supply is only facing a demand of about 600,000
tonnes. Hence, currently, China’s manufacturers have reduced the production
dramatically, also due to a fierce market competition, high transportation
costs, and the pressure from environmental protection measurements. As a
result, the total output in 2016 reached just about 350,000 tonnes, which eases
the overcapacity accordingly.
The
biggest buyer of potato starch in China consists of the food industry,
accounting for almost 80% of total share. For comparison, high developed
countries use this commodity mainly in the pharmaceuticals, textiles, paper
making, and petroleum industry.
Currently,
potato starch is used for desserts and as a thickening agent in Chinese food
and hospitality industry. However, despite its excellent thickening effects, high
prices have always slowed down a large popularity of potato starch.
In
Jan. 2015, China put forward the strategy of "promoting potato as staple
food", aiming to increase the consumption of potato products to more than
30% in 2020. According to the 13th Five-year Plan for the Potato Processing
Industry (2016-2020), China's output of potato vermicelli shall reach 400,000
to 600,000 tonnes in 2020, up 17%-71% from the target set during the previous
12 Five-year Plan period (2010-2015).
MSG
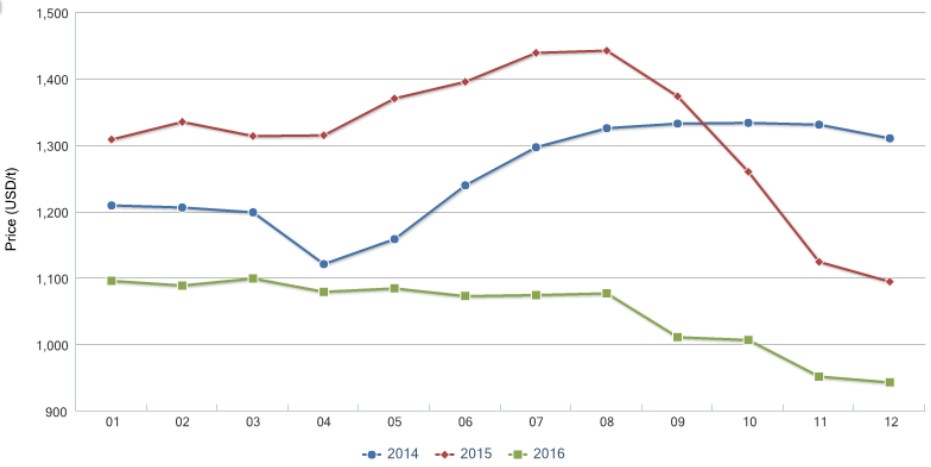
Despite
other food ingredients in China, MSG has reached its historically lowest price
in December 2016, with a value of USD942.6/t, after an already long period of a
continuously falling trend.
The monthly ex-works
price of MSG in China, Jan. 2014-Dec. 2016
Source: CCM
Reasons
for the bad performance of MSG in China is the dumping corn price. As corn is
the major raw material for MSG, the price fell alongside with the decreasing
price of corn. Furthermore, the production capacity of MSG was growing
constantly, leaving to a situation of oversupply and hence to falling prices
again. The oversupply is still serious looking at an annual output of
2.7million tonnes with a demand of only 1.4 million tonnes and an export volume
by 420,000 tonnes.
The
MOC finalised the antidumping and anti-subsidy duties on imported DDGS from the
US. CCM believes that this move will further reduce Chinese DDGS import volume,
strengthen demand for corn and soybean meal, and stimulate the supply of
alcohol.
DDGS
On
January 11, 2017, the Ministry of Commerce of the People's Republic of China
(MOC) stated that the USA was ruled to have dumped DDGS into China, which has
caused substantial damage to the Chinese DDGS industry. As a result, China
decided to respectively impose 42.2%-53.7% and 11.2%-12.0% of anti-dumping and
anti-subsidy duties on DDGS from the USA for 5 years, starting on January 12,
2017.
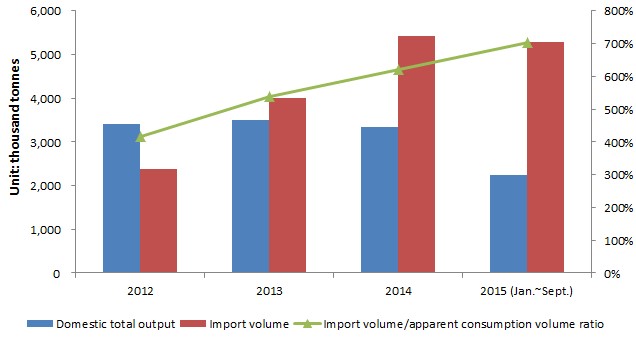
As
the largest DDGS importer in the world, China mainly imported DDGS from the
USA. American DDGS enjoys a lower price as well as higher quality than Chinese
DDGS. Coupled with the surging domestic corn price in the past few years, the
import volume of DDGS have risen significantly. According to China Customs,
import volume reached 6.82 million tonnes in 2015, up 26.1% YoY. In addition, the
proportion of apparent consumption volume of imported DDGS climbed 70.2% in
Jan.-Sept. 2015 from 41.6% in 2012.
Output, import volume
and apparent consumption volume of DDGS in China, 2012-2015 (Jan.-Sept.)
Source: MOC
What’s
more, DDGS is a by-product of corn alcohol, which can be used as a raw material
in feed to provide energy and protein. Therefore, DDGS is a good
substitute for corn and soybean meal. In 2016, China's corn price slumped and
dragged down the domestic DDGS price, resulting in sharply falling import
volume of DDGS. According to China Customs, the country imported about 3
million tonnes of DDGS in Jan.-Nov. 2016, which represents a down 46.8% YoY.