In H1 2016, despite the depressed pesticide market, the pesticide industry recorded small YoY rises in total assets, total
revenue and total profit.

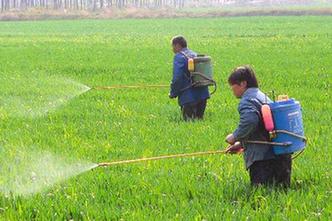
Source: Baidu
According to the National Bureau of
Statistics of the People's Republic of China (NBS), in H1 2016, total revenue
from pesticide enterprises' primary businesses amounted to USD24.60 billion
(RMB163.03 billion), while industry profit totaled USD22.09 billion (RMB114.28
billion), slightly up 5.40% and 4.70% YoY respectively.
Specifically, total
profits from biochemical and microbial pesticides rose by 27.40% YoY, vs.
chemical pesticide TC by 2.20% YoY. Obviously, sales of biochemical and
microbial pesticides were far greater than those of chemical pesticides, and
made a much larger contribution to the entire pesticide industry.
In recent years, biochemical pesticides
have garnered more attention from the industry, and new products have been
continually introduced and promoted, due to the aim of zero growth in the use
of chemical pesticides in China as well as pests' increasing resistance to
chemical pesticides.
Biochemical pesticides are predicted to become more
popular in the near future, but since the biochemical pesticide market is far
less developed or mature than the chemical pesticide market, chemical
pesticides are widely expected to maintain their position as leading products in
the crop protection market.
Financial performance of pesticide
enterprises in China, H1 2016
|
Industry
|
Number
of enterprises
|
Total
assets
|
Revenue
from main business
|
Total
profit
|
|
Jan.-June
2016 (billion USD)
|
YoY
change (%)
|
Jan.-June
2016 (billion USD)
|
YoY
change (%)
|
Jan.-June
2016 (billion USD)
|
YoY
change (%)
|
|
Chemical
pesticide manufacturing
|
816
|
35.15
|
7.10
|
24.60
|
5.40
|
1.72
|
4.70
|
|
Chemical
pesticide technical manufacturing
|
678
|
31.73
|
5.90
|
22.09
|
4.40
|
1.51
|
2.20
|
|
Biochemical
and microbial pesticide manufacturing
|
138
|
3.42
|
19.50
|
2.51
|
14.90
|
0.21
|
27.40
|
Source: NBS
Structural adjustments to the international
economy and falling grain prices around the world. In this context, the demand
for pesticides is weakened, which has in turn dragged down Chinese imports and
exports of pesticides. Year 2015 witnessed falls in both imports and exports
from China's pesticide industry for the first time, and this trend continued
into H1 2016.
In the meantime, as China continues to aim for zero growth in the
use of chemical pesticides, making environmental requirements stricter and
strengthening safety supervision, the domestic pesticide industry faces
significant change. For example, the new Regulations on the Control of
Agricultural Chemicals is to be implemented soon, which will greatly affect the
pesticide industry.

Production and sales by domestic pesticide
enterprises were influenced by serious overcapacity, insufficient market
demand, fierce competition, and low product prices within the industry.
According to 2016 H1 financial reports released by a number of listed pesticide
enterprises, most suffered YoY falls in revenue and profit, and some even made
losses.
So far this year, prices of
glufosinate-ammonium, paraquat TK, and dicamba have fallen by more than 50%,
45% and 30% YoY respectively.
Notably, in H1 2016, the number of
pesticide enterprises at loss declined by 12.10% YoY and the loss by value was
USD73.33 million (RMB486 million), down 17.60% YoY. The loss by scale (=number
of enterprises at loss / total number of enterprises) declined by 1.35
percentage points YoY.
Losses of China's pesticide industry, H1
2016
|
Industry
|
Number
of enterprises
|
Number
of enterprises at loss
|
Loss
by value (million USD)
|
Loss
by scale (%)
|
|
Jan.-June
2016
|
YoY
change (%)
|
Jan.-June
2016
|
YoY
change (%)
|
Jan.-June
2016
|
YoY
change (%)
|
|
Chemical
pesticide manufacturing
|
816
|
80
|
-12.10
|
73.33
|
-17.60
|
9.80
|
-1.35
|
|
Chemical
pesticide technical manufacturing
|
678
|
69
|
-10.40
|
68.65
|
-19.10
|
10.18
|
-1.18
|
|
Biochemical
and microbial pesticide manufacturing
|
138
|
11
|
-21.40
|
4.68
|
-14.50
|
7.97
|
-2.17
|
Note: Loss by scale = number of enterprises
at loss / total number of enterprises
Source: NBS
This article comes from Herbicides China News 1608, CCM

About CCM:
CCM is the leading market intelligence provider for China's
agriculture, chemicals, food & ingredients and life science markets. Founded in 2001, CCM offers a
range of data and content solutions, from price and trade data to industry
newsletters and customized market research reports. Our clients include Monsanto,
DuPont, Shell, Bayer, and Syngenta. CCM is a brand of Kcomber Inc.
For more information about CCM, please visit www.cnchemicals.com or get in touch with us
directly by emailing econtact@cnchemicals.com or calling
+86-20-37616606.
Tag: pesticide